highlight_shrink: 天池赛题:天猫重复购学习笔记(我的EDA模板) 字段解释都在:这里 这里
复购率 = 重复购买用户数量/用户样本数量
复购率 = 重复购买行为次数(或 交易次数)/用户样本数量
[TOC]
EDA步骤 1.看数据类型、数量、样例 无疑是一些pd.readcsv( )和data.info()、data.head()。大致看一看
1 2 3 4 5 train_one_value = [col for col in train.columns if train[col].nunique() <= 1 ] test_one_value = [col for col in test.columns if test[col].nunique() <= 1 ] print('one value featrues in train:' ,train_one_value) print('one value featrues in test: ' ,test_one_value)
2.区分类别变量和连续变量 一般类别变量的处理和连续型变量的处理不一样
1 2 3 4 5 6 7 8 9 10 11 12 13 14 15 16 17 18 19 20 21 22 23 24 25 def split_features (df,colnums,nums=30 ): label_features={} continue_features={} for key in colnums: nunique=df[key].nunique() if np.issubdtype(df[key][0 ],np.int ) and nunique<=nums: label_features.update({key:nunique}) elif np.issubdtype(df[key][0 ],np.float ) and nunique<=nums: label_features.update({key:nunique}) else : continue_features.update({key:nunique}) print(label_features) user_info_colnums=user_info.columns.values user_log_colnums=user_log.columns.values train_colnums=train.columns.values lable_nunique_maxnums=20 print('user_info:' ) split_features(user_info,colnums=user_info_colnums,nums=lable_nunique_maxnums) print('user_log :' ) split_features(user_log,colnums=user_log_colnums,nums=lable_nunique_maxnums) print('train :' ) split_features(train,colnums=train_colnums,nums=lable_nunique_maxnums)
可知
3.看是否有缺失值
插补方法
说明
优点
缺点
使用环境
类均值插补
数值型:均值。
简单易行:被插补的值比较稳定
不能反映缺失值的变异性;低估资料变异
低缺失率首选
类随机插补
聚类填充;使用所有可能的值填充;组合完整化方法
能体现数据变异性
依赖于观测值
低缺失率
回归插补
基于完整的数据集,建立回归方程(模型)
方差估计好
稳定性依赖于辅助变量,抽样误差不易控制
变量间的相关性强
Em 插补
通过观测数据的边际分布可以对未知参数进行极大似然估计
利用充分,考虑了缺失值的不确定性
计算复杂
高缺失率
多重插补 MCMC
估计出持插补的值,然后加上不同的噪声,形成多组可选插补值
利用充分,考虑了缺失值的不确定性
计算复杂
高缺失率首选
1 2 3 4 5 6 7 8 9 10 11 12 13 def missing_value_rate (data,col_name ): rate_list = {} for col in col_name: rate = (data.shape[0 ]-data[col].count())/data.shape[0 ] lable_foamt = 'rate:{}' .format (rate) rate_list[col]=lable_foamt return rate_list
1 2 3 4 print('age_range:' ,user_info[user_info['age_range' ].isna() | (user_info['age_range' ]==0 )].count()) print() print('gender:' ,user_info[user_info['gender' ].isna() | (user_info['gender' ]==0 )].count()) missing_value_rate(user_info,user_info.columns)
4.观察数据分布、不均衡样本 不均衡样本,可采用
随机欠采样
随机过采样
基于聚类的过采样
SMOTE算法
基于数据清洗的SMOTE
首先describe()看一看。
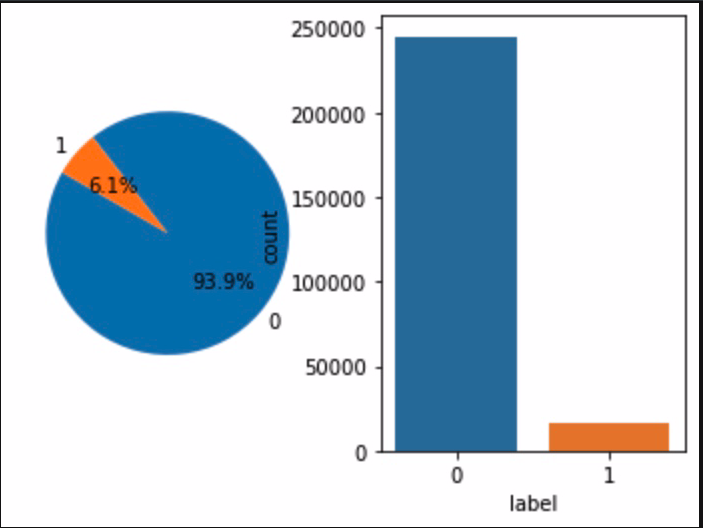
正负样本分布 1 2 label_gp = train.groupby('label' )['user_id' ].count() print('正负样本数量:' ,label_gp)
1 2 3 4 5 6 7 8 9 10 11 fig = plt.figure() ax = plt.subplot(1 ,2 ,1 ) labels = [0 ,1 ] sizes = [label_gp[0 ],label_gp[1 ]] explode = (0 ,0 ) plt.pie(sizes,explode=explode,labels=labels,autopct='%1.1f%%' ,shadow=False ,startangle=150 ) plt.subplot(1 ,2 ,2 ) sns.countplot(train['label' ]) plt.show()
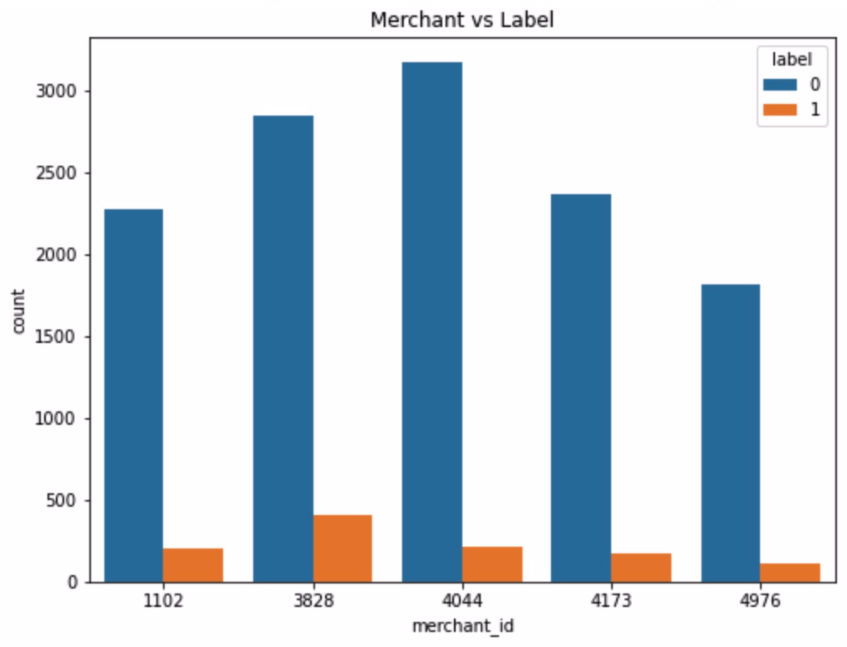
对店铺的分析 1 2 3 4 5 6 7 8 train.merchant_id.value_counts().head() train_data_merchant = train.copy() train_data_merchant['TOP5' ]=train_data_merchant['merchant_id' ].map (lambda x:1 if x in [4044 ,3828 ,4173 ,1102 ,4976 ] else 0 ) train_data_merchant = train_data_merchant[train_data_merchant['TOP5' ]==1 ] plt.figure(figsize=(8 ,6 )) plt.title('Merchant vs Label' ) sax = sns.countplot('merchant_id' ,hue='label' ,data=train_data_merchant)
对比一下top5店铺回购的比例,可看出不同店铺复购率不同,可能与店铺售卖商品和运营有关。
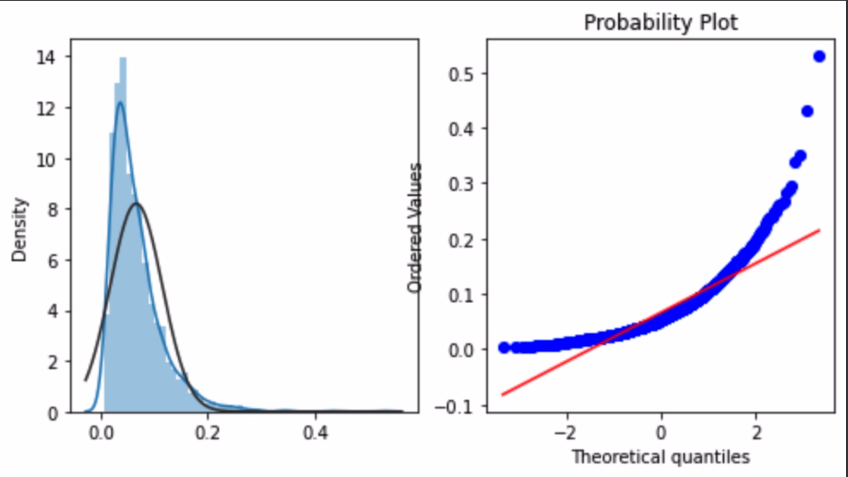
1 2 3 4 5 6 7 8 9 10 merchant_repeat_buy = [rate for rate in train.groupby(['merchant_id' ])['label' ].mean() if rate<=1 and rate>0 ] plt.figure(figsize=(8 ,4 )) import scipy.stats as statsax = plt.subplot(1 ,2 ,1 ) sns.distplot(merchant_repeat_buy,fit=stats.norm) ax = plt.subplot(1 ,2 ,2 ) res = stats.probplot(merchant_repeat_buy,plot=plt)
不同店铺有不同的复购率,在0到0.3之间。
对用户方面的分析 通过user_id/age_range/gender等方面
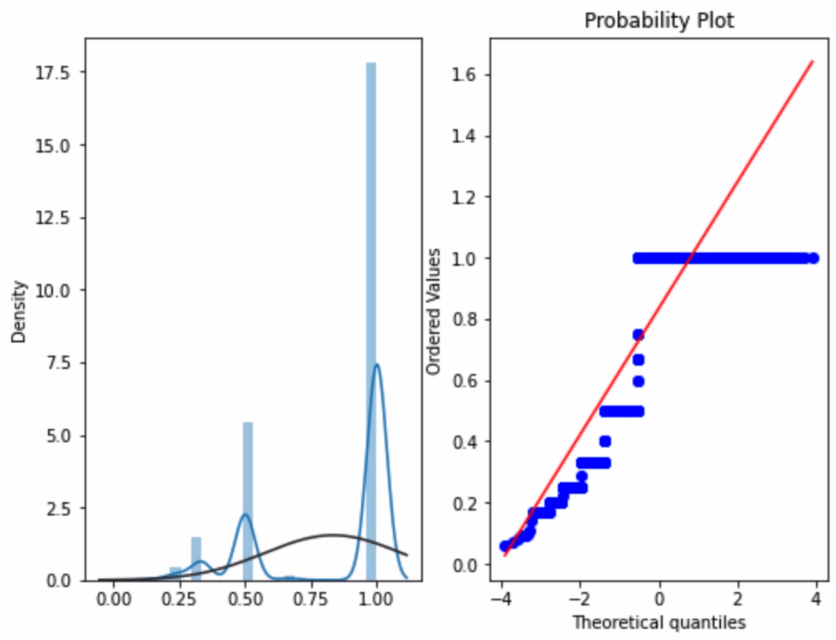
1 2 3 4 5 6 7 8 9 10 11 user_repeat_buy = [ rate for rate in train.groupby(['user_id' ])['label' ].mean() if rate <=1 and rate>0 ] plt.figure(figsize=(8 ,6 )) ax = plt.subplot(1 ,2 ,1 ) sns.distplot(user_repeat_buy,fit=stats.norm) ax = plt.subplot(1 ,2 ,2 ) res = stats.probplot(user_repeat_buy,plot=plt)
看出进六个月用户复购概率很小,基本为一次买主
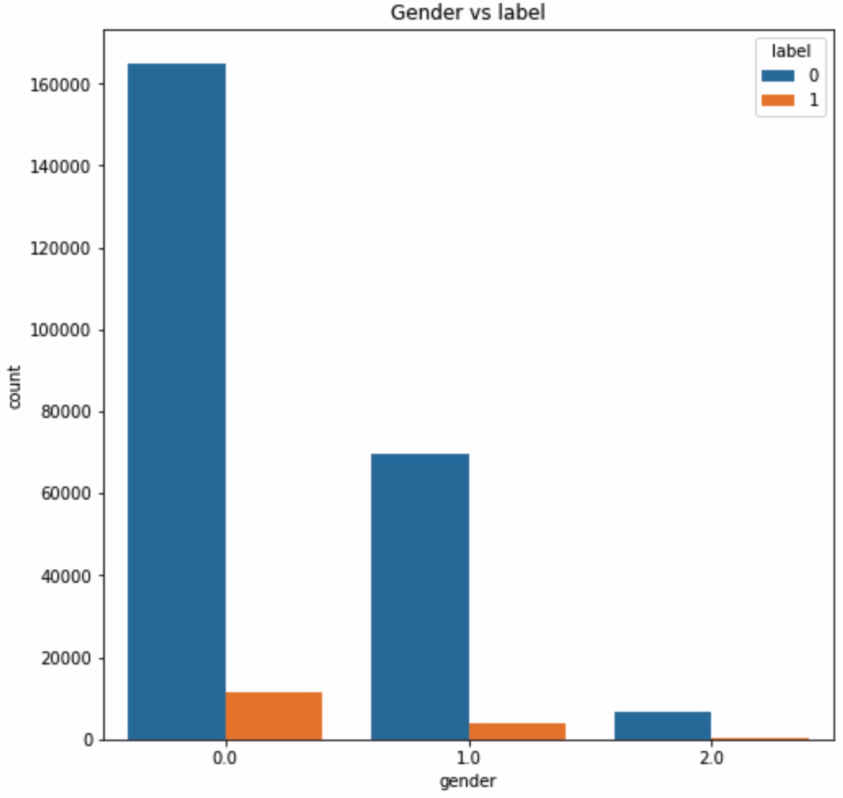
1 2 3 4 5 6 7 8 train_user_info =train.merge(user_info,on=['user_id' ],how='left' ) plt.figure(figsize=(8 ,8 )) plt.title('Gender vs label' ) ax = sns.countplot('gender' ,hue='label' ,data=train_user_info) for p in ax.patches: height = p.get_height()
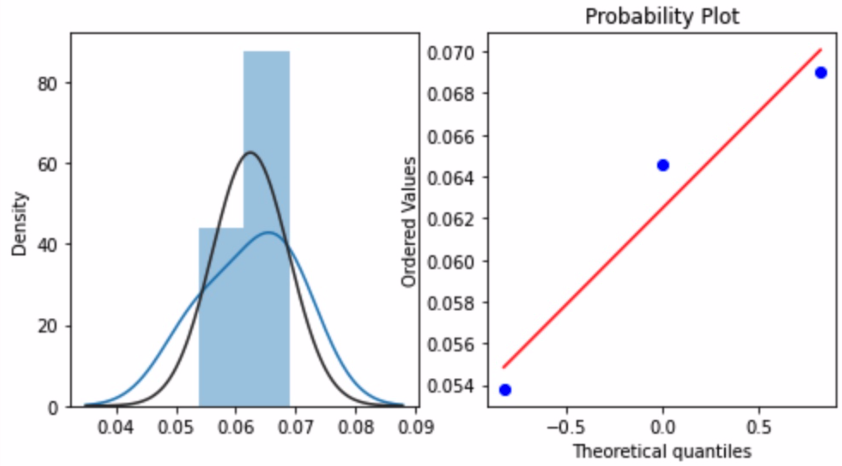
1 2 3 4 5 6 7 8 9 repeat_buy = [rate for rate in train_user_info.groupby(['gender' ])['label' ].mean()] plt.figure(figsize=(8 ,4 )) ax = plt.subplot(1 ,2 ,1 ) sns.distplot(repeat_buy,fit=stats.norm) ax = plt.subplot(1 ,2 ,2 ) res = stats.probplot(repeat_buy,plot=plt)
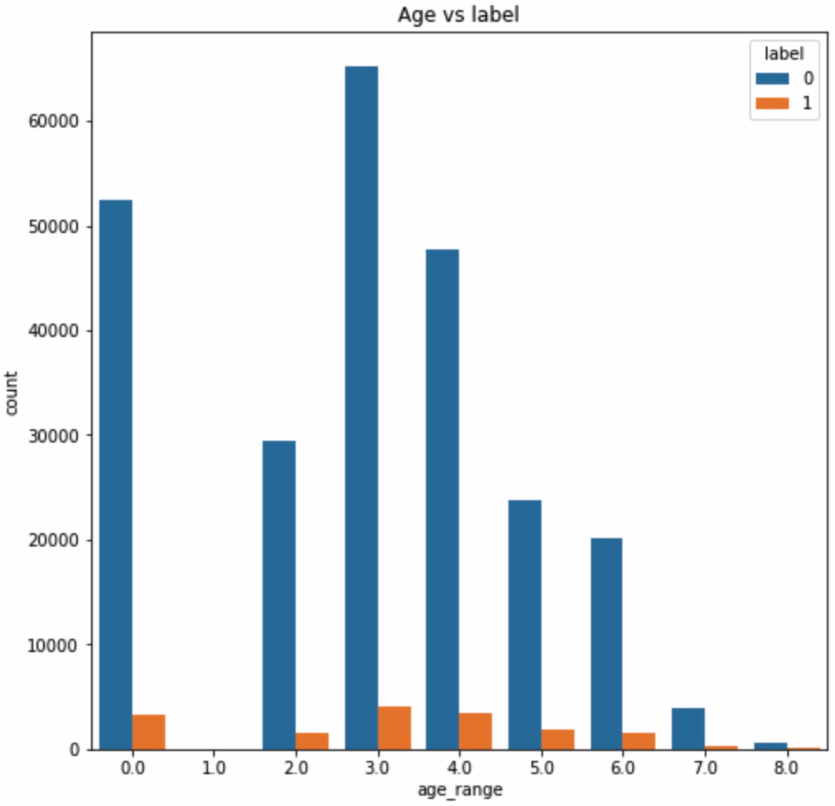
1 2 3 4 plt.figure(figsize=(8 ,8 )) plt.title('Age vs label' ) ax = sns.countplot('age_range' ,hue='label' ,data = train_user_info)
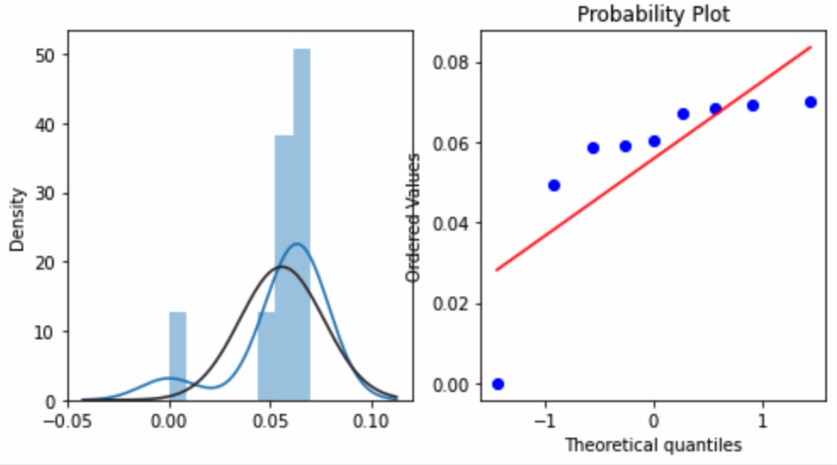
1 2 3 4 5 6 7 8 9 10 repeat_buy = [rate for rate in train_user_info.groupby(['age_range' ])['label' ].mean()] plt.figure(figsize=(8 ,4 )) ax = plt.subplot(1 ,2 ,1 ) sns.distplot(repeat_buy,fit=stats.norm) ax = plt.subplot(1 ,2 ,2 ) res = stats.probplot(repeat_buy,plot=plt)
5.对比训练集和测试集分布 6.探查重要影响因素 1 2 3 4 colormap = plt.cm.viridis plt.figure(figsize=(14 ,12 )) plt.title('Pearson Correaltion of Feature' ,y=1.05 ,size=15 ) sns.heatmap(train_user_info.astype(float ).corr(),linewidths=0.1 ,vmax=1.0 ,square=True ,cmap=colormap,linecolor='white' ,annot=True )
特征工程 类别型特征的转换:决策树等少数模型能直接处理字符串形式的输入。
特征组合 1、离散特征可两两组合成高阶组合特征,高维组合特征处理的目的是提高复杂关系的拟合能力。
是否点击
uid=1,item=1
uid=2,item=2
….
uid=n,item=n
0
1
0
…
0
1
0
1
…
0
当uid有10000个,item有10000个时有100000000一般可采用SVD分解降低参数,还可以增加参数的迭代拟合数量,防止过拟合。
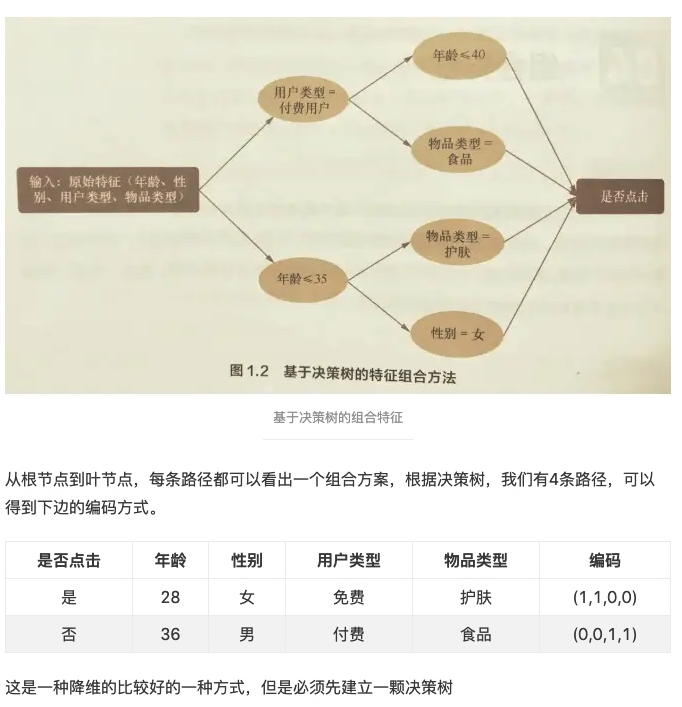
2、决策树组合特征:
模型训练 模型验证 特征优化 EDA代码技巧罗列(方便快速拷贝) 画字段测试集和训练集数量对比饼图 1 2 3 4 5 6 7 8 def pie_category (train,test ): plt.figure(figsize=[9 ,7 ]) train.value_counts().plot.pie() print("train:" ,Counter(train)) print("test:" ,Counter(test)) pie_category(train.XINGBIE,test.XINGBIE)
选择Dataframe数据集中的某几列 1 2 3 4 5 6 7 8 9 10 11 12 13 from sklearn.base import BaseEstimator,TransformerMixinclass DataFrameSelector (BaseEstimator,TransformerMixin ): def __init__ (self,attribute_names ): self.attribute_names = attribute_names def fit (self,X,y=None ): return self def transform (self,X ): return X[self.attribute_names] lianxu_train = DataFrameSelector(column_lianxu).transform(train) lianxu_test = DataFrameSelector(column_lianxu).transform(test)
多列KDE分布 1 2 3 4 5 6 7 8 9 10 11 12 13 14 15 16 17 18 19 dist_cols = 3 dist_rows = len (column_lianxu) plt.figure(figsize=(4 * dist_cols, 4 * dist_rows)) lianxu_train = DataFrameSelector(column_lianxu).transform(train) lianxu_test = DataFrameSelector(column_lianxu).transform(test) i = 1 for col in column_lianxu: ax = plt.subplot(dist_rows, dist_cols, i) ax = sns.kdeplot(lianxu_train[col], color="Red" , shade=True ) ax = sns.kdeplot(lianxu_test[col], color="Blue" , shade=True ) ax.set_xlabel(col) ax.set_ylabel("Frequency" ) ax = ax.legend(["train" , "test" ]) i += 1 plt.show()
包库常用设置拷贝 1 2 3 4 5 6 7 8 9 10 11 12 13 14 15 16 17 18 19 20 21 22 23 24 25 26 27 28 import seaborn as snsimport pandas as pdimport numpy as npimport lightgbm as lgbfrom scipy import statsimport matplotlibfrom sklearn.metrics import roc_auc_scorefrom sklearn.model_selection import train_test_splitimport gcimport warningsfrom collections import Counterwarnings.filterwarnings("ignore" ) import matplotlib.pyplot as pltplt.rcParams.update({'figure.max_open_warning' : 0 }) pd.set_option('expand_frame_repr' , False ) pd.set_option('display.width' , 100 ) pd.set_option('max_rows' , 100 ) pd.set_option('max_columns' , 100 ) pd.set_option('max_colwidth' , 16 ) pd.set_option('large_repr' , 'truncate' ) pd.set_option('show_dimensions' , True ) sns.set_style("whitegrid" ) matplotlib.rcParams['font.sans-serif' ] = ['SimHei' ] matplotlib.rcParams['font.family' ]='sans-serif' matplotlib.rcParams['axes.unicode_minus' ] = False matplotlib.fontsize='20'
查看类别特征是否测试集类别有不在训练集的 1 2 3 4 5 6 7 8 9 10 test_outof_train=[] for key in label_features: test_unique=test_df[key].unique().tolist() train_unique=train_df[key].unique().tolist() for index in test_unique: if index not in train_unique: test_outof_train.append(key) break test_outof_train
类别特征分布 1 2 3 4 5 6 7 8 9 10 11 12 def show_label_features_distribution (df1,df2,Y=None ): df1=df1.value_counts().sort_index() df2=df2.value_counts().sort_index() df=pd.concat([df1,df2],axis=1 ) feature_name=df.columns[0 ] df.columns=['train' ,'test' ] df.plot.bar(title=feature_name) print(feature_name,'\n' ,df) for key in label_features:q show_label_features_distribution(train_df[key],test_df[key])
连续特征分布 1 2 3 4 5 6 7 8 9 10 11 12 13 14 15 def show_continue_features_distribution (df1,df2 ): feature_name=df1.name g = sns.kdeplot(df1.values, color="Red" , shade = True ) g = sns.kdeplot(df2.values, ax =g, color="Green" , shade= True ) g.set_xlabel(feature_name) g.set_ylabel("Frequency" ) g = g.legend(["train" ,"test" ]) plt.show() describe=pd.concat([df1.describe(),df2.describe()],axis=1 ) describe.columns=[f'train {feature_name} ' ,f'test {feature_name} ' ] print(describe) for key in continue_featues: show_continue_features_distribution(train_df[key],test_df[key])
清理缓存 1 2 3 4 def clear_mem (): %reset -f out %reset -f in gc.collect()
参考文献 matplotlib 知识点11:绘制饼图(pie 函数精讲) 决策树中的类别特征问题(关于label encode还是one-hot的讨论) kaggle编码categorical feature总结 TF-IDF算法介绍及实现 Python中的TfidfVectorizer参数解析 关于target encoding与count encoding
